Chapter 4 Basic Reactivity
Exercise 4.3.6.1
Draw the reactive graph for the following server functions:
server1 <- function(input, output, session) {
  c <- reactive(input$a + input$b)
  e <- reactive(c() + input$d)
  output$f <- renderText(e())
}

server2 <- function(input, output, session) {
  x <- reactive(input$x1 + input$x2 + input$x3)
  y <- reactive(input$y1 + input$y2)
  output$z <- renderText(x() / y())
}

server3 <- function(input, output, session) {
  d <- reactive(c() ^ input$d)
  a <- reactive(input$a * 10)
  c <- reactive(b() / input$c)
  b <- reactive(a() + input$b)
}Solution.
Solution
To create the reactive graph we need to consider the inputs, reactive expressions, and outputs of the app.
For server1 we have the following objects:
- inputs:
input$a,input$b, andinput$d - reactives:
c()ande() - outputs:
output$f
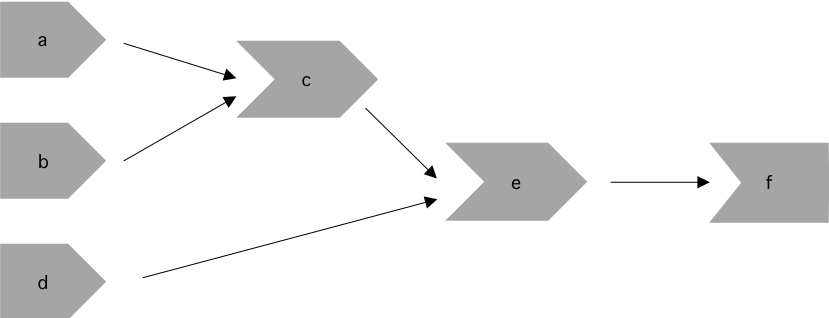
Inputs input$a and input$b are used to create c(), which is combined with
input$d to create e(). The output depends only on e().

reactive graph - server 1
For server2 we have the following objects:
- inputs:
input$y1,input$y2,input$x1,input$x2,input$x3 - reactives:
y()andx() - outputs:
output$z
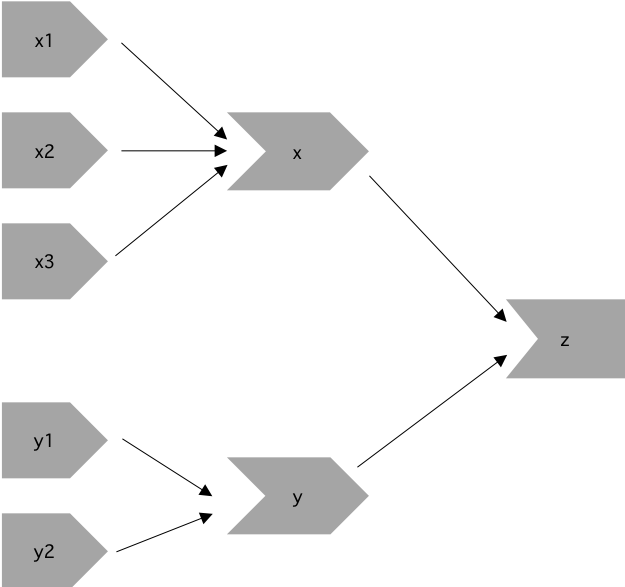
Inputs input$y1 and input$y2 are needed to create the reactive y(). In
addition, inputs input$x1, input$x2, and input$x3 are required to create
the reactive x(). The output depends on both x() and y().

reactive graph - server 2
For server3 we have the following objects:
- inputs:
input$a,input$b,input$c,input$d - reactives:
a(),b(),c(),d()
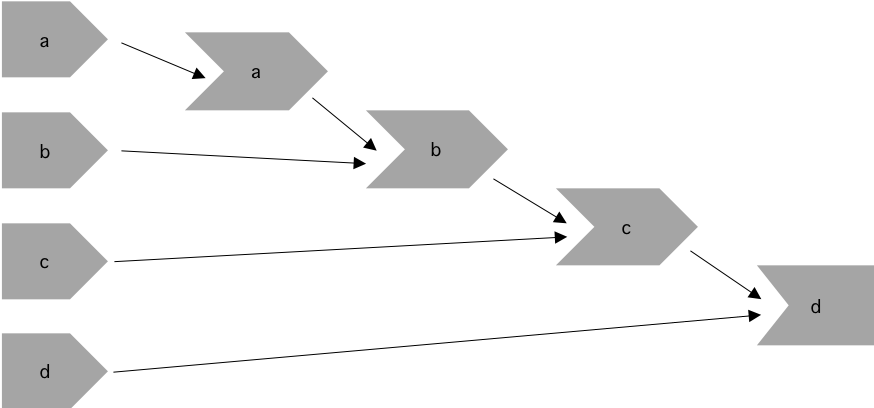
As we can see below, a() relies on input$a, b() relies on both a() and
input$b, and c() relies on both b() and input$c. The final output
depends on both c() and input$d.

reactive graph - server 3
Exercise 4.3.6.2
Why will this code fail?
var <- reactive(df[input$var])
range <- reactive(range(var(), na.rm = TRUE))
Why is var() a bad name for a reactive?
Solution.
Solution
This code doesn’t work because we called our reactive range, so when we call the range function we’re actually calling our new reactive. If we change the name of the reactive from range to col_range then the code will work. Similarly, var() is not a good name for a reactive because it’s already a function to compute the variance of x! ?cor::var
library(shiny)

df <- mtcars

ui <- fluidPage(
    selectInput("var", NULL, choices = colnames(df)),
    verbatimTextOutput("debug")
)

server <- function(input, output, session) {
    col_var <- reactive( df[input$var] )
    col_range <- reactive({ range(col_var(), na.rm = TRUE ) })
    output$debug <- renderPrint({ col_range() })

}

shinyApp(ui = ui, server = server)